Ceramic, Simulation
TEIDE REFRACTORY SOLUTIONS UTILISES HEATEIDE® TO KNOW THE EVOLUTION OF THE TEMPERATURES AT THE BOTTOM OF THE FURNACE. PART 2.
The Technical and Simulation Departments of TEIDE REFRACTORY SOLUTIONS are firm supporters of using finite element software for the thermal calculations of its client’s furnaces. TEIDE REFRACTORY SOLUTIONS offers its clients finite element calculation tools for the complete analysis of the thermal phenomena occurring in their industrial processes.
What is the temperature at the bottom of the furnace?
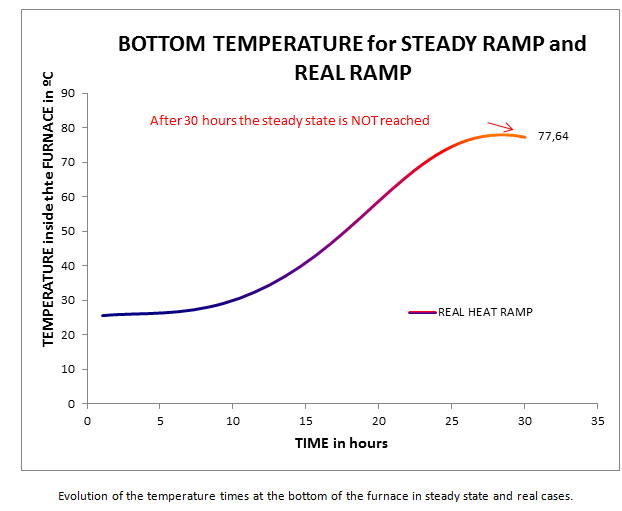
In the previous post we demonstrated that at least 60 hours must pass at a constant temperature of 950º C before the temperature at the bottom of the furnaces stabilises. In that case, what is the temperature at the bottom of the furnace in a normal cycle? To answer this question we performed a simulation of the same furnace, this time subjected to a heat ramp of 30 hours and 950º C. The following graph compares both temperature ramps studied.
- Comparison of the simulated heat ramps
Results
- The following video shows the evolution of the temperatures over time for a real ramp of 30h and 950º C. It is seen that the existence of various components with different thermal characteristics can easily be resolved with HEATEIDE®.
- Temperature evolution over time
The bottom of the furnace is the area that takes the longest time to reach the balance temperature. The evolution of the temperature at the bottom of the furnace is shown in the following graph, along with the constant temperature applied to the upper side of the furnace:
Conclusions
HEATEIDE® makes it possible to know the evolution of the temperatures over time in any part of the furnace, as opposed to other types of software that make important mistakes in the thermal calculations. For advice related to thermal calculation with finite elements using HEATEIDE®, please contact our sales staff.